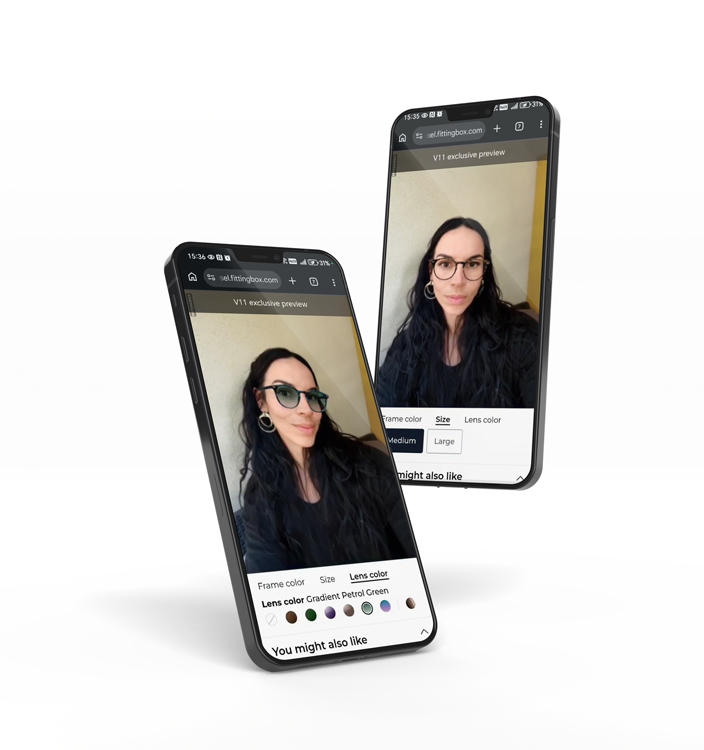
Virtual try-on is becoming a standard way to sell products that are hard to judge on a flat screen.
In 2026, the value is less about novelty and more about measurable gains: higher conversion, fewer returns, and a smoother path to purchase across categories like eyewear and footwear.

Why virtual try-on is an e-commerce performance lever in 2026
Most e-commerce friction is not about price. It is about confidence.
Customers hesitate when they cannot picture how a product will look, fit, or scale in real life. This “confidence gap” shows up as slower decisions, more browsing without buying, and higher return risk.
The confidence gap is bigger for products people wear
Wearables add personal variables: face shape, foot width, skin tone, styling preferences, and comfort expectations.
That is why categories like eyewear and footwear benefit from experiences that translate product data into something customers can actually evaluate.
Instead of asking shoppers to imagine, try-on virtually gives them a fast visual answer that supports action.
Returns are still a margin drain
Returns remain one of the largest hidden costs in commerce. The National Retail Federation and Happy Returns estimate that 16.9% of annual sales were returned in 2024, representing $890B in returns.
NRF’s 2025 returns research projects $849.9B in total returns and expects 19.3% of online sales to be returned.
This is why many retailers are tightening return policies and charging fees. Improving pre-purchase clarity is often the simplest way to protect margin without sacrificing demand.
If you want a category example, eyewear brands often start with virtual try-on for glasses because it addresses both style hesitation and fit confidence.
The 5 benefits teams actually care about
In a leadership conversation, virtual try-on succeeds when it connects to performance metrics.
These are the benefits that usually matter most to e-commerce, marketing, and sales stakeholders in 2026.
1) Conversion lift and faster decisions
VTO helps shoppers move from “maybe” to “yes” faster.
When customers can evaluate a product on themselves, the buying decision becomes less abstract. That typically increases add-to-cart behavior on product pages and improves checkout completion.
This is especially relevant for new visitors who have not yet learned your sizing, fit, or quality standards.
2) Return reduction through clearer expectations
Many returns are not about product defects. They are about mismatch between expectations and reality.
Try-on virtually reduces that mismatch by helping customers choose with more certainty.
In wearables, this is often tied to visual impact and perceived fit, which are common reasons behind “not as expected” returns.
3) Higher AOV and better merchandising
Once the shopper trusts the core product, upsell becomes easier.
For shoes, that can mean premium materials, accessories, or care products. For eyewear, it often means lenses, coatings, or second-pair purchases.
Virtual try-on supports merchandising by making comparisons easier and reducing the risk of choosing “the wrong one.”
4) Lower CAC through stronger landing experiences
Paid traffic is expensive. VTO can increase the value of each click by improving product understanding quickly.
When your ad promise is immediately supported by an interactive try-on, more visitors become qualified shoppers, not passive browsers.
This is one reason many brands treat VTO as both a conversion tool and a performance marketing asset.
5) Better UX signals for SEO and repeat visits
UX and revenue are linked. A smoother product evaluation flow reduces friction and helps customers feel confident enough to return for future purchases.
It can also strengthen on-site engagement signals by keeping shoppers on product pages longer and guiding them into deeper browsing.
For a practical perspective on experience design, see how to enhance the online user experience.
Where VTO works best (and where it does not)
VTO is not a magic fix for every store. It performs best when it reduces uncertainty that blocks purchase.
In 2026, the biggest wins tend to happen in categories where fit, appearance, or scale are the decision drivers.
High-impact categories
- Eyewear: shoppers want to see proportion on their face and compare shapes quickly.
- Footwear: shoppers want visual confidence and better sizing cues, especially for style-forward purchases.
- Beauty: shade selection and real-world preview reduce regret and returns.
- Jewelry and watches: scale and styling become clearer than with static photos.
When VTO will not fix your funnel
If your product content is weak, VTO will not save the page.
If sizing data is inconsistent, users will still hesitate. If performance is slow, users will bounce. If your PDP is confusing, try-on virtually will be ignored.
VTO works when it is part of a clean, fast, decision-oriented product page.
It also needs solid 3D product foundations. That is why many teams pair VTO with interactive product visualization such as a 3D viewer to standardize how products are presented across the catalog.
Implementation basics for e-commerce and marketing teams
The fastest way to miss results is to treat VTO like a widget.
The fastest way to win is to treat it like a measurable product capability with clear placement, tracking, and iteration.
Placement that influences the decision
- PDP near the price and CTA so try-on is part of the decision moment.
- Product listing previews to help shoppers narrow options sooner.
- Campaign landing pages to improve click-to-engagement and qualification.
- Category pages for “best sellers” and “new arrivals” where comparison matters.
Content and 3D readiness
Performance depends on credibility.
That means realistic rendering, reliable color, and consistent product measurements. It also means a catalog strategy so the experience feels coherent across SKUs.
If you need internal proof points, linking VTO to real outcomes is easier when you can reference examples. A useful starting point is e-commerce case studies.
Tracking and experimentation plan
Track VTO as a funnel, not a feature.
- Activation rate: percent of visitors who start the experience.
- Post-activation add-to-cart rate: the most important behavior signal.
- Conversion rate by cohort: new vs returning visitors, paid vs organic.
- Return rate by reason code: “style,” “fit,” “not as expected.”
Use A/B tests where possible. If not, roll out by category in phases so you can compare performance cleanly.

ROI model you can adapt
A ROI conversation usually needs two levers: increased orders and reduced returns.
Returns are still massive at the retail level, which is why the business case often resonates fastest with finance.
Inputs to collect
- Monthly sessions on PDPs where VTO will be enabled.
- Baseline conversion rate and gross margin.
- Baseline return rate and top return reasons.
- Average order value and support cost per order.
Simple framework
| Metric |
Your baseline |
Target with VTO |
What it changes |
| Monthly sessions |
__________ |
Same |
Same traffic, better outcomes |
| Conversion rate |
__________ |
+0.1 to +0.3 points |
More orders without deeper discounts |
| Return rate |
__________ |
-1 to -4 points |
Lower reverse logistics and write-offs |
| Gross margin |
__________ |
Stable or higher |
Less margin leakage from returns |
How to defend the business case internally
Frame VTO as a performance tool that improves decision quality.
Then measure net impact: incremental gross profit minus VTO program cost and incremental content production.
Finally, connect it to what the market is doing. Grand View Research estimates the global virtual try-on market at $9.17B in 2023 and projects strong growth through 2030.
As a measure of good strategy, focus on where uncertainty blocks the sale, implement VTO where it influences decisions, and prove impact with a tight KPI framework before scaling across categories.